Skip to content
Academic backing

What standsbehind the engine.

The model's figures are not invented — and they don't work in just one place. Trained and validated in Latin America on ~3.94 million clinical records from 382,589 patients, and further confirmed on NIH All of Us (626,396 US patients): calibration and the ability to rank risk hold up in a different population, without retraining. All under the TRIPOD+AI protocol, with the derivation paper published in IJCRP 2026 (open access).

External validation · Latin America and the USA

Trained and validated in Latin America.Also confirmed on 626,396 US patients.

Corpus AI was trained on ~3.94 million clinical records from 382,589 Latin American patients (Colombia, 1990–2025) and externally validated in Latin America on an insurer never seen during training. An additional independent external validation in the NIH All of Us program confirms that calibration and risk-ranking hold in the US too — the same model, no retraining.

3.94 M clinical records · LatAm
382,589 patients · LatAm cohort
626,396 adults · US validation
E/O ≈ 0.98 expected/observed calibration

Trained and validated in Latin America

  • ~3.94 million clinical records from 382,589 Latin American patients, 1990–2025 (Colombia).
  • External validation on a Latin American insurer never seen during training (n = 5,602; F = 147.6; p < .001).
  • Calibration survives the population shift: expected/observed ≈ 0.98 — when the model says 20%, ~20% happens.

Confirmed in the US — the same model, no retraining

  • Applied as-is to 626,396 US adults in NIH All of Us (median follow-up 5.8 years).
  • Evidence of transportability across countries and health systems; AUC ranks, but what matters is that the probability is real.
  • The top decile by risk concentrates a disproportionate share of real cases — actionable prioritization (per-disease capture is on each model).

Diverse and international

  • 626,396 adults aged 18 to 89, with age well distributed across groups.
  • ~55% white · ~18% Hispanic/Latino · ~16% Black · ~4% multiracial · ~3.5% Asian · ~62% women.
  • Equity: stable performance across age, sex, and ethnicity (AUROC differences ≤ 0.10; no subgroup collapses).

Pre-specified protocol frozen before execution (TRIPOD+AI style). Validation inside the secure All of Us Researcher Workbench; only aggregate results were exported (groups ≥ 20 people), in line with its privacy policies.

Corpus AI canonical models

The evidence,disease by disease.

A complete cardio-metabolic-renal risk suite: five canonical models delivered —AMI, stroke, hypertension, DM and CKD— plus mental health. Pick a model and see its evidence. Hold-out figures with 95% bootstrap CI (n=1000, seed 2026), verified calibration (ECE) and SHA-256 traceability; AUC ranks, but what matters is that the probability is real.

Choose a disease to see its evidence

Heart attack (AMI)

Validated in production

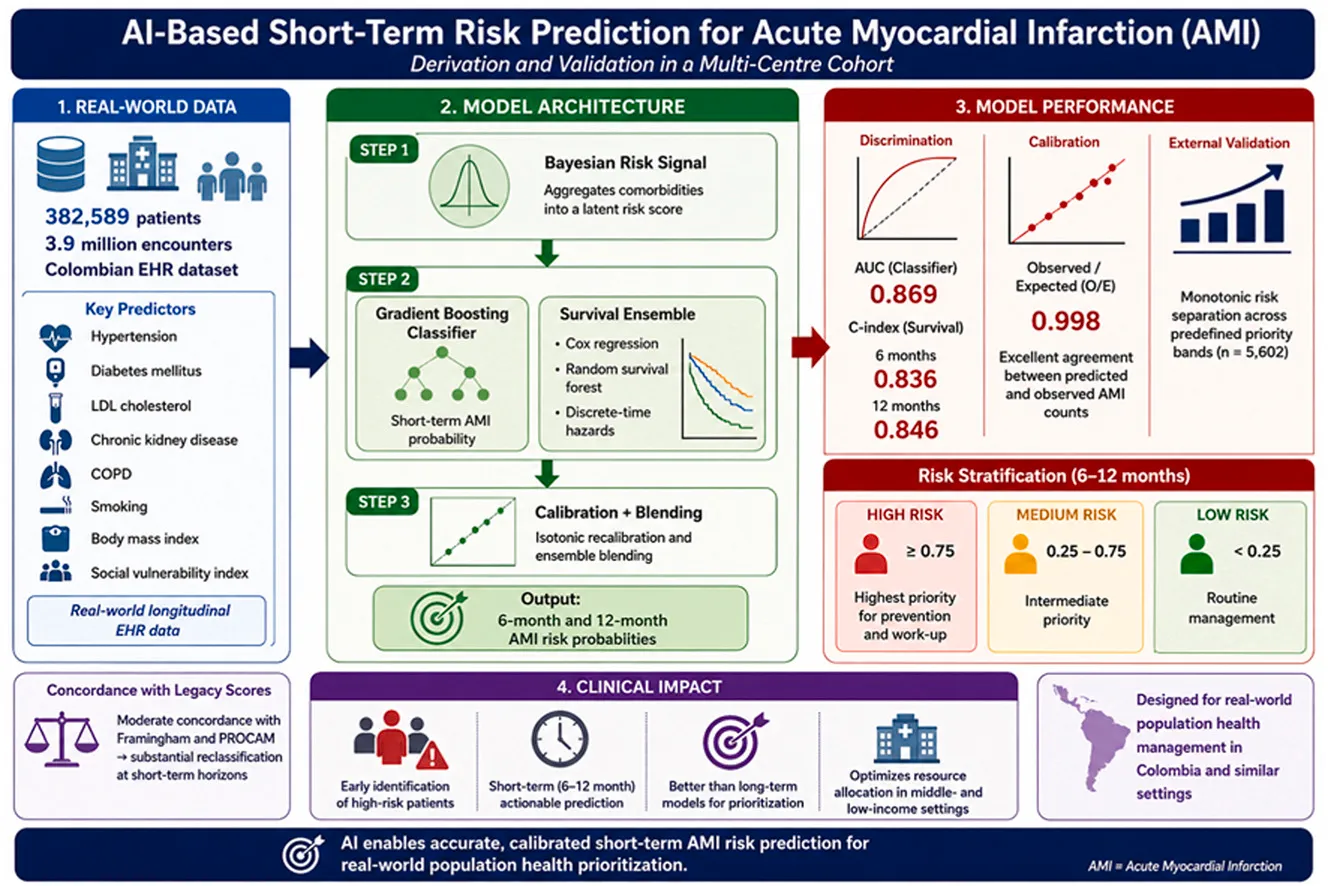
The flagship model: derived and validated on a cardiovascular cohort of 382,589 patients, published in IJCRP 2026 and externally validated on All of Us. It is the only one in formal production — +241 AMIs prevented in a real deployment.

  • AUC 0.869 discrimination (published · IJCRP)
  • O/E 0.998 near-perfect calibration
  • +241 AMIs prevented in production −20% AMIs per month in a real deployment.
Published · IJCRP 2026

The paper documentingderivation and validation.

Published Open Access · CC BY 4.0

A next-generation prediction risk model for acute myocardial infarction: Derivation and validation in a multi-centre cohort

Amorocho-Morales JD, Parra-Guevara S, Quintero-Muñoz E, Dimas G, Correa-Morales JE. Int J Cardiol Cardiovasc Risk Prev (IJCRP). 2026.

Vol. 30, art. 200659

  • 382,589 patients
  • AUC 0.869 discrimination
  • O/E 0.998 calibration
Abstract

We present a predictive model for acute myocardial infarction trained and validated on a Latin American cardiovascular cohort of 382,589 unique patients followed between 1990 and 2025, with 3,940,059 clinical encounters and 15,511 observed AMIs. The model operates on routine clinical data, no advanced imaging, no special biomarkers, and reports near-perfect calibration (O/E 0.998), robust discrimination (AUC 0.869, C-index 6m 0.836, C-index 12m 0.846), and significant external validation on an insurer never seen during training (n=5,602, F=147.6, p<.001). The separation between operating bands (observed rate 54.6% / 38.1% / 21.0%) shows that calibration survives the population shift. The reporting follows the TRIPOD+AI standard (BMJ 2024).

Study graphical abstract: short-term acute myocardial infarction risk prediction on a Colombian cohort of 382,589 patients, showing real-world data, model architecture, performance (AUC 0.869, O/E 0.998), risk stratification, and clinical impact.
Article graphical abstract · © the authors · CC BY 4.0
Routine clinical data

An integrated cardiovascularcohort of Colombia, 1990–2025.

The model was trained on real clinical practice, not on a trial. That is what lets the probabilities reflect the population they are applied to.

Unique patients 382,589

Deduplicated identifiers across the 35-year window.

Clinical encounters 3,940,059

Visits, hospitalizations, and events recorded in the system.

Observed infarctions 15,511

Confirmed AMI events (coding + clinical verification).

External validation n = 5,602

Insurer never seen during training · F = 147.6 · p < .001.

1990 – 2025 Observation period
Discrimination, calibration, and validation

The figures that backevery prediction.

The model's metrics in academic form with citations. Computed on the full cohort and reproduced in the external validation.

What is O/E?

When the model says 22%, it is 22% in reality.

O/E (observed over expected) compares how many events actually occurred against how many the model predicted. A value near 1.0 means the model's probabilities are numerically correct: when it says 22% risk at 12 months, the patient really does have a 22% chance of AMI in the actual cohort, not 5%, not 60%. That is what lets you use the probability as a clinical threshold, share it with the patient, and define operating bands. Discrimination (AUC, C-index) tells you the order is right; calibration tells you the numbers are real.

O/E
0.998
Near-perfect calibration. The numerical probability the model reports matches the observed rate in the cohort.
AUC
0.869
Discrimination: the model separates patients who will have an AMI from those who will not in 86.9% of random pairs.
C-index 6m
0.836
Time-aware discrimination at 6 months: the priority order matches the actual order of event occurrence.
C-index 12m
0.846
Time-aware discrimination at 12 months. Concordance holds when the prediction horizon is extended.

External validation on an insurer never seen during training. The separation between bands holds, calibration survives the population shift.

5,602

Patients

147.6

F statistic

<.001

p value

Observed rate per band
High 54.6%
Medium 38.1%
Low 21.0%

Classic models (Framingham, SCORE2, PROCAM, PREVENT) measure 10-year risk on European or American cohorts. Applied as-is in LATAM they overpredict: O/E < 1. The system ends up prioritizing people who won't have the event.

Systematic LATAM pattern: Framingham and SCORE2 overpredict (O/E < 1). Sex-adjusted PROCAM partially closes the calibration gap in Colombia. Caritas calibrates almost perfectly on the real cohort.

Modelo
AUC
O/E
Scope
Corpus AI
0.869
0.998
Colombia · 1990–2025 · AMI 6–12 m
Framingham Fuente: Muñoz 2014 · n=1,013
0.658
0.76
Colombia · primary prevention · 10 years
PROCAM (sex-adj) Fuente: Muñoz 2014 · n=1,013
0.744
0.94
Colombia · best localized model · 10 years
SCORE2 Fuente: López-López 2025 · n=2,022
0.68 – 0.72
22–42% overprediction
Colombia · PURE cohort · 12.3 years
Framingham Fuente: Camargos 2024 · n=12,155
0.77
0.38
Brazil · ELSA · 4.2 years
SCORE2 Fuente: Camargos 2024 · n=12,155
0.76
0.63
Brazil · ELSA · recalibrated low-risk
PREVENT (AHA) Fuente: Mancini 2024 · Scheuermann 2024
,
,
No external LATAM validation with incident outcomes as of May 2026
Reported under TRIPOD+AI · BMJ 2024

Stroke

Internal validation (CV)

The best discriminator and best capture in the suite: the top 10% by risk concentrates 58.5% of strokes, nearly six times the base rate.

  • 58.5% capture in the top 10% by risk ≈5.8× the base rate — the best in the suite.
  • ECE 0.00006 calibration (excellent)
  • AUC 0.851 discrimination 95% CI 0.83–0.87.
  • Prioritizes by coronary equivalent, age >75, and a CHA₂DS₂-VASc proxy.

Hypertension

Internal validation (CV)

Predicts incident-hypertension risk so you can intervene before it sets in.

  • 44.7% capture in the top 10% by risk ≈4.5× the base rate.
  • AUC 0.826 discrimination 95% CI 0.82–0.83.
  • Prioritizes by medication pattern (number of antihypertensives, CCB, beta-blocker) and obesity.

Glycemic dysregulation (DM)

Under construction

Predicts incident —not prevalent— glycemic dysregulation, with a clean label and no data leakage. Internally validated and on its way to production.

  • 33.6% capture in the top 10% by risk ≈3.4× the base rate.
  • ECE 0.008 calibration (good)
  • AUC 0.771 discrimination 95% CI 0.76–0.78 · PPV@Youden 41.7%.
  • Prioritizes by insulin, years of hypertension, age, and SGLT2i use.

Under construction with academic cohorts in the US and Europe.

Kidney disease (CKD)

Internal validation (CV)

Renal progression. In the top 10% by risk the positive predictive value is 81%: of every 10 flagged patients, ~8 progress.

  • PPV 81% in the top 10% by risk of every 10 flagged, ~8 progress.
  • 24.4% capture in the top 10% by risk ≈2.4× the base rate.
  • AUC 0.719 discrimination 95% CI 0.69–0.75 · ECE 0.033 (acceptable).
  • AUC 0.72 is the honest information ceiling: the earlier 0.95 version had data leakage and was corrected — a methodological credibility point, not a weakness.

Mental health

In local recalibration

In mental health we start from validated, published screening instruments and peer-reviewed risk models. We are recalibrating them to the local population before reporting probabilities — true to our philosophy: first make the number real.

Validated, published instruments

  • PHQ-9 Depression Kroenke 2001; Colombia validation Cassiani-Miranda 2020 · Rev Colomb Psiquiatr · DOI 10.1016/j.rcp.2019.09.001
  • GAD-7 Anxiety Spitzer 2006; Spanish version García-Campayo 2010 · DOI 10.1186/1477-7525-8-8
  • PSS-10 Perceived stress Remor 2006 · DOI 10.1017/s1138741600006004; Colombia Campo-Arias 2021
  • CBI Occupational burnout Kristensen 2005; Spanish version Molinero 2013 · DOI 10.4321/S1135-57272013000200006

Published models it builds on

  • predictD C-index 0.79 King 2008 · Arch Gen Psychiatry · DOI 10.1001/archpsyc.65.12.1368
  • predictA (Spain) C-index 0.79 Moreno-Peral 2014 · PLOS ONE · DOI 10.1371/journal.pone.0106370
  • HILDA (common mental disorders) C-index 0.66–0.73 Fernandez 2017 · Aust N Z J Psychiatry · DOI 10.1177/0004867417704506
  • Inoue (mental-cause sick leave) AUC 0.71–0.82 Inoue 2026 · J Occup Health · DOI 10.1093/joccuh/uiag011

The instruments are validated and published; the models are peer-reviewed and under local recalibration. We do not report a production probability in mental health until that calibration is complete.

Verifiable references

The referencesbehind the work.

Filter by reference type
  1. Muñoz OM, Rodríguez NI, Ruiz Á, Rondón M. Validación de los modelos de predicción de Framingham y PROCAM en una población colombiana. Rev Colomb Cardiol. 2014;21(4):202–212.

    paper
  2. Hageman SHJ, McKay AJ, et al.. SMART2 risk prediction algorithm. Eur Heart J. 2022;43(18):1715–1727.

    paper
  3. Mancini GBJ, Ryomoto A. Adoption of the PREVENT Risk Algorithm: Potential International Implications. JACC Adv. 2024;3(8):101122.

    paper
  4. Scheuermann B, Brown A, et al.. External Validation of the AHA PREVENT Cardiovascular Disease Risk Equations. JAMA Netw Open. 2024;7(10):e2438311.

    paper
  5. WHO CVD Risk Chart Working Group. WHO CVD risk charts: revised models for 21 global regions. Lancet Glob Health. 2019;7(10):e1332–e1345.

    guideline
  6. Collins GS, Moons KGM, et al.. TRIPOD+AI statement. BMJ. 2024;385:e078378.

    standard
  7. Liu T, Krentz A, Lu L, Curcin V. ML-based prediction models for CVD risk using EHR data: systematic review and meta-analysis. Eur Heart J Digit Health. 2024;6(1):7–22.

    paper
  8. Damen JA, Pajouheshnia R, et al.. Performance of the Framingham risk models and pooled cohort equations. BMC Med. 2019;17(1):109.

    paper
  9. Amorocho-Morales JD, Parra-Guevara S, Quintero-Muñoz E, Dimas G, Correa-Morales JE. A next-generation prediction risk model for acute myocardial infarction: Derivation and validation in a multi-centre cohort. Int J Cardiol Cardiovasc Risk Prev. 2026;30:200659. doi:10.1016/j.ijcrp.2026.200659.

    paper
  10. Krittanawong C, Virk HUH, et al.. Machine learning prediction in cardiovascular diseases: meta-analysis. Sci Rep. 2020;10(1):16057.

    paper
  11. Kroenke K, Spitzer RL, Williams JB. The PHQ-9: validity of a brief depression severity measure. J Gen Intern Med. 2001;16(9):606–613.

    DOI →
  12. Cassiani-Miranda CA, Cuadros-Cruz AK, et al.. Validity of the Patient Health Questionnaire-9 (PHQ-9) for depression screening in Colombia. Rev Colomb Psiquiatr. 2020.

    DOI →
  13. Spitzer RL, Kroenke K, Williams JB, Löwe B. A brief measure for assessing generalized anxiety disorder: the GAD-7. Arch Intern Med. 2006;166(10):1092–1097.

    DOI →
  14. García-Campayo J, Zamorano E, et al.. Cultural adaptation into Spanish of the GAD-7. Health Qual Life Outcomes. 2010;8:8.

    DOI →
  15. Remor E. Psychometric properties of a European Spanish version of the Perceived Stress Scale (PSS). Span J Psychol. 2006;9(1):86–93.

    DOI →
  16. Molinero Ruiz E, Basart Gómez-Quintero H, Moncada Lluis S. Validation of the Spanish version of the Copenhagen Burnout Inventory (CBI). Rev Esp Salud Publica. 2013;87(2):165–179.

    DOI →
  17. King M, Walker C, et al.. Development and validation of an international risk prediction algorithm for episodes of major depression (predictD). Arch Gen Psychiatry. 2008;65(12):1368–1376.

    DOI →
  18. Moreno-Peral P, Luna JD, et al.. Predicting the onset of anxiety syndromes at 12 months in primary care (predictA). PLOS ONE. 2014;9(9):e106370.

    DOI →
  19. Fernandez A, Salvador-Carulla L, et al.. Development and validation of a prediction algorithm for the onset of common mental disorders (HILDA). Aust N Z J Psychiatry. 2018;52(1):47–58.

    DOI →
  20. Inoue S, et al.. Predicting mental health–related sick leave using stress check data. J Occup Health. 2026;68(1):uiag011.

    DOI →

Talk with the team

Want to dig deeperinto the methodology?

30 minutes with the clinical-technical team. We walk through the published paper, discuss the calibration methodology, and explore what the model would look like on your own cohort. We respond within 2 business days.